Press release 28/11/2025
ENVIRONMENTAL ACCOUNTS: ENVIRONMENTAL GOODS AND SERVICES ACCOUNT, 2023
The Gross Value Added generated by the environmental economy in the Basque Country increased by 10.5% in 2023 and by 53.7% since 2015
The environmental economy created 27,778 jobs in 2023, 25.3% more than in 2015 and 4.3% more than in 2022, accounting for 2.86% of total employment
According to Eustat data, the environmental economy in the Basque Country generated Gross Value Added (GVA) of 2,305 million euros in 2023, representing 2.47% of the economy’s total Gross Domestic Product (GDP). Compared to 2022, the year-on-year growth rate for environmental GVA stood at 10.5%, exceeding the 7.5% increase in GDP for the economy as a whole over the same period. Between 2015 and 2023, environmental GVA increased by 53.7%, while the GDP of the Basque economy as a whole grew by 34.9%.
The Environmental Goods and Services Account is part of the system of environmental accounts and is prepared according to Eurostat's methodology. These accounts allow for a coherent integration of economic and environmental aspects into the National Accounts System. The Environmental Goods and Services sub-sector (Environmental Economy) is composed of the segment of the economy dedicated to the production of goods and services for environmental protection and activities related to the management of natural resources to reduce or eliminate environmental pressures.
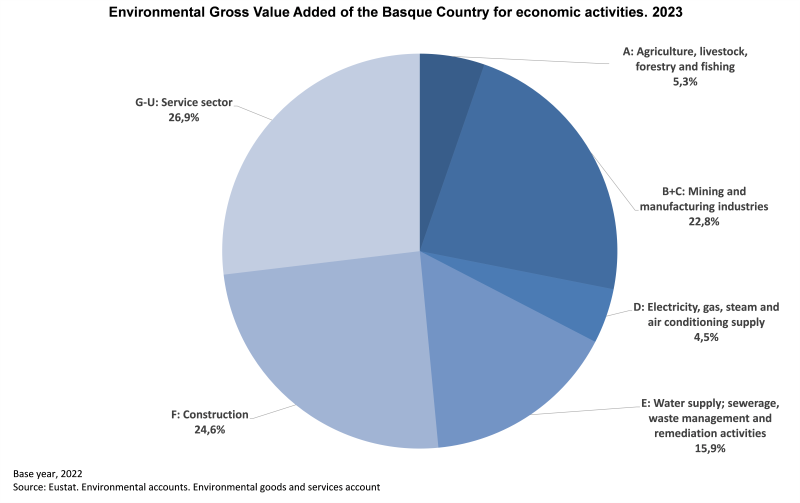
By economic sector and in relation to environmental GVA, in 2023, the contribution of the Services sector stood out, with 26.9%; followed by Construction, with 24.6%; Extraction and Manufacturing Industries, with 22.8%; Water Supply, Sanitation and Waste Management activities, with 15.9%; and, lastly, the sectors of Agriculture, Livestock, Forestry and Fishing and Electricity, Gas, Steam and Air Conditioning Supply, with 5.3% and 4.5%.
Gross Value Added to the environmental goods and services sector of the Basque Country by activity groups. 2015-2023


| |
Environmental GVA (thousands of euros) |
% of Environmental GVA |
Annual variation rate (%) |
| |
2015 |
2022 |
2023 |
2015 |
2022 |
2023 |
2023/2015 |
2023/2022 |
| TOTAL Environmental GVA |
1,499,933 |
2,085,929 |
2,305,072 |
100.0 |
100.0 |
100.0 |
53.7 |
10.5 |
| A: Agriculture, livestock, forestry and fishing |
65,731 |
122,326 |
122,606 |
4.4 |
5.9 |
5.3 |
86.5 |
0.2 |
| B+C: Mining and manufacturing industries |
206,448 |
427,183 |
525,142 |
13.8 |
20.5 |
22.8 |
154.4 |
22.9 |
| D: Electricity, gas, steam and air conditioning supply |
96,580 |
66,131 |
103,611 |
6.4 |
3.2 |
4.5 |
7.3 |
56.7 |
| E: Water supply; sewerage, waste management and remediation activities |
305,488 |
382,461 |
367,193 |
20.4 |
18.3 |
15.9 |
20.2 |
-4.0 |
| F: Construction |
356,396 |
497,509 |
566,541 |
23.8 |
23.9 |
24.6 |
59.0 |
13.9 |
| G-U: Service sector |
469,290 |
590,319 |
619,979 |
31.2 |
28.2 |
26.9 |
32.1 |
5.0 |
| GDP p/m |
69,111,800 |
86,714,411 |
93,242,571 |
|
|
|
34.9 |
7.5 |
Base 2022
Date November 28, 2025
Source: Eustat. Environmental accounts. Environmental goods and services account
In terms of the evolution of the internal composition of environmental GVA between 2015 and 2023, Extraction and Manufacturing Industries stood out, with a rise of 154.4%, going from representing 13.8% of total environmental GVA in 2015 to 22.8% in 2023. Agriculture, Livestock, Forestry and Fishing and Construction also increased their contribution to total environmental GVA between 2015 and 2023, while the remaining sectors saw their contributions decline.
By economic sector and in order of importance, in 2023, environmental employment in the Services sector accounted for 31.8% of total environmental employment, followed by Construction, with 26.6%; Extraction and Manufacturing Industries, with 18.6%; and Water Supply, Sanitation and Waste Management activities, with 17.3%. Meanwhile, the sectors that contributed the least to total environmental employment were Agriculture, Livestock, Forestry and Fishing (5.2%) and Electricity, Gas, Steam and Air Conditioning Supply (0.5%).
Full-time equivalent jobs (FTE) of the Basque Country in the environmental goods and services sector by activity groups. 2015-2023
| |
Environmental FTE employment |
% on environmental employment |
Annual variation rate (%) |
| |
2015 |
2022 |
2023 |
2015 |
2022 |
2023 |
2023/2015 |
2023/2022 |
| Total Environmental FTE |
22,161 |
26,643 |
27,778 |
100.0 |
100.0 |
100.0 |
25.3 |
4.3 |
| A: Agriculture, livestock, forestry and fishing |
735 |
1,388 |
1,444 |
3.3 |
5.2 |
5.2 |
96.5 |
4.0 |
| B+C: Mining and manufacturing industries |
2,519 |
4,562 |
5,155 |
11.4 |
17.1 |
18.6 |
104.6 |
13.0 |
| D: Electricity, gas, steam and air conditioning supply |
187 |
110 |
150 |
0.8 |
0.4 |
0.5 |
-19.8 |
36.4 |
| E: Water supply; sewerage, waste management and remediation activities |
4,598 |
4,947 |
4,800 |
20.8 |
18.6 |
17.3 |
4.4 |
-3.0 |
| F: Construction |
5,698 |
6,837 |
7,393 |
25.7 |
25.7 |
26.6 |
29.7 |
8.1 |
| G-U: Service sector |
8,424 |
8,799 |
8,836 |
38.0 |
33.0 |
31.8 |
4.9 |
0.4 |
| Full-time equivalent of the total economy |
886,487 |
952,509 |
970,243 |
|
|
|
9.4 |
1.9 |
Base 2022
Date November 28, 2025
Source: Eustat. Environmental accounts. Environmental goods and services account
In terms of the evolution of the internal composition of environmental employment between 2015 and 2023, Extraction and Manufacturing Industries stood out once again, with a rise of 104.6% over the same period, going from representing 11.4% of total environmental employment in 2015 to 18.6% in 2023. Agriculture, Livestock, Forestry and Fishing and Construction also increased their contribution to the composition of total environmental employment, while the remaining sectors saw their contributions decline. Electricity, Gas, Steam and Air Conditioning Supply was the only sector in which environmental employment fell between 2015 and 2023.
Looking at the main indicators that relate environmental figures to the economy as a whole, environmental GVA represented 2.47% of GDP in 2023, while environmental employment, measured in terms of full-time equivalent (FTE) jobs, accounted for 2.86% of total FTE employment in 2023. In 2015, environmental GVA represented 2.17% of GDP, while environmental FTE employment accounted for 2.50% of total FTE employment.
Indicators of environmental goods and services of the Basque Country by environmental objective. 2015-2023
| |
Environmental GVA over % GDP |
Environmental Employment (FTE) over Total Employment (FTE) |
| |
2015 |
2022 |
2023 |
2015 |
2022 |
2023 |
| Environmental Total |
2.17 |
2.41 |
2.47 |
2.50 |
2.80 |
2.86 |
| A: Agriculture, livestock, forestry and fishing |
0.10 |
0.14 |
0.13 |
0.08 |
0.15 |
0.15 |
| B+C: Mining and manufacturing industries |
0.29 |
0.49 |
0.56 |
0.29 |
0.48 |
0.53 |
| D: Electricity, gas, steam and air conditioning supply |
0.14 |
0.08 |
0.11 |
0.02 |
0.01 |
0.02 |
| E: Water supply; sewerage, waste management and remediation activities |
0.44 |
0.44 |
0.39 |
0.52 |
0.52 |
0.49 |
| F: Construction |
0.52 |
0.58 |
0.61 |
0.64 |
0.72 |
0.76 |
| G-U: Service sector |
0.68 |
0.68 |
0.67 |
0.95 |
0.92 |
0.91 |
Base 2022
Date November 28, 2025
Source: Eustat. Environmental accounts. Environmental goods and services account
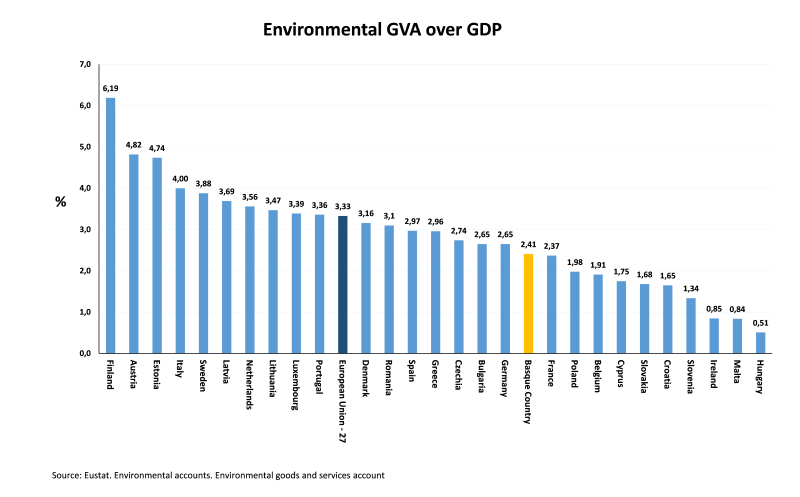
For the comparison with the rest of Europe, the latest data published by Eurostat for 2022 were analysed. The indicator of environmental GVA as a percentage of GDP in the Basque Country was estimated at 2.41%, which was higher than in countries such as France (2.37%) and Poland (1.98%), but lower than in others such as Germany (2.65%), Bulgaria (2.65%) and Spain (2.97%). These figures placed the Basque Country below the average for the EU27 (3.33%), where countries such as Finland (6.19%), Austria (4.82%) and Estonia (4.74%) led the way in terms of the contribution of environmental GVA to the economy as a whole.
In accordance with European regulations, the Environmental Goods and Services Account is prepared using the new Classification of Environmental Purposes (CEP). The "environmental purpose" is structured around the main objective pursued in relation to environmental protection and is broken down at divisional level (environmental domain) for some environmental purposes and at a more detailed group level for other purposes.
Environmental Gross Value Added of the Basque Country by environmental purpose. 2015-2023
| |
Environmental GVA (thousands of euros) |
% of Environmental GVA |
Annual variation rate (%) |
| |
2015 |
2022 |
2023 |
2015 |
2022 |
2023 |
2023/2015 |
2023/2022 |
| TOTAL CEP |
1,499,933 |
2,085,929 |
2,305,072 |
100.0 |
100.0 |
100.0 |
53.7 |
10.5 |
| CEP 01 - Air and climate |
87,234 |
173,780 |
180,253 |
5.8 |
8.3 |
7.8 |
106.6 |
3.7 |
| CEP 0201 - Energy from renewable sources |
54,825 |
74,101 |
93,312 |
3.7 |
3.6 |
4.0 |
70.2 |
25.9 |
| CEP 0202 - Energy savings and management |
413,057 |
581,275 |
702,131 |
27.5 |
27.9 |
30.5 |
70.0 |
20.8 |
| CEP 0301 - Wastewater management |
59,238 |
71,601 |
66,865 |
3.9 |
3.4 |
3.0 |
12.9 |
-6.6 |
| CEP 0302 - Water savings and management of natural water resources |
10,175 |
13,016 |
14,936 |
0.7 |
0.6 |
0.6 |
46.8 |
14.8 |
| CEP 0401 - Waste management |
237,325 |
294,663 |
279,229 |
15.8 |
14.1 |
12.2 |
17.7 |
-5.2 |
| CEP 0402 - Materials recovery and savings |
140,611 |
214,261 |
230,958 |
9.4 |
10.3 |
10.0 |
64.3 |
7.8 |
| CEP 0501 - Protection of soil, surface and groundwater |
86,262 |
85,848 |
97,395 |
5.7 |
4.1 |
4.2 |
12.9 |
13.5 |
| CEP 0502 - Protection of biodiversity and landscape |
9,881 |
14,331 |
15,910 |
0.7 |
0.7 |
0.7 |
61.0 |
11.0 |
| CEP 0503 - Management of forest resources |
74,757 |
111,291 |
106,677 |
5.0 |
5.3 |
4.6 |
42.7 |
-4.1 |
| CEP 06 - Noise and radiation |
86,426 |
138,972 |
184,438 |
5.8 |
6.7 |
8.0 |
113.4 |
32.7 |
| CEP 07 - Research and development |
81,177 |
133,439 |
153,140 |
5.4 |
6.4 |
6.6 |
88.6 |
14.8 |
| CEP 08 - Cross-cutting and other environmental purposes |
158,965 |
179,351 |
179,828 |
10.6 |
8.6 |
7.8 |
13.1 |
0.3 |
| GDP p/m |
69,111,800 |
86,714,411 |
93,242,571 |
|
|
|
34.9 |
7.5 |
Base 2022
Date November 28, 2025
Source: Eustat. Environmental accounts. Environmental goods and services account
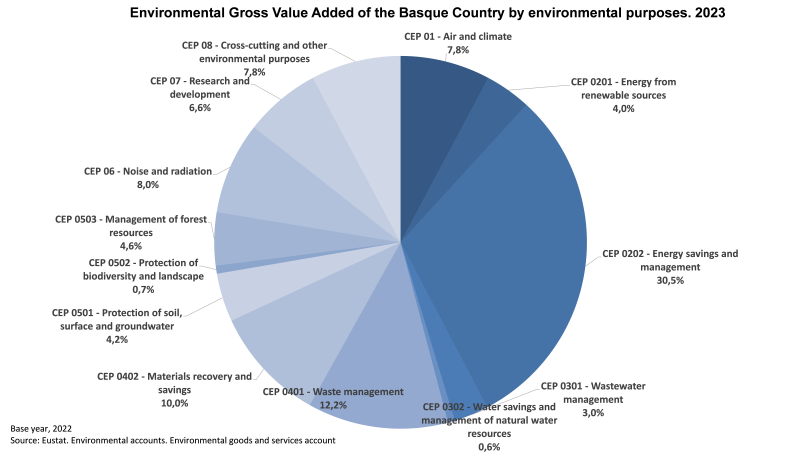
The environmental purpose that stood out for the largest contribution to environmental GVA in 2023 was Energy savings and management, with 30.5% of the total. It was followed by Waste management, with 12.2%, and Materials recovery and savings, with 10.0%. Other environmental purposes that made a significant contribution (of over 5.0%) to the composition of environmental GVA were: protection against Noise and radiation (8.0% of total environmental GVA); reduction and control of emissions affecting the Air and climate and Other cross-cutting environmental purposes, both representing 7.8% of environmental GVA; and Environmental R&D, with 6.6% of total environmental GVA in 2023.
Between 2015 and 2023, the environmental purposes that saw the greatest increases in their contribution to the composition of environmental GVA were Noise and radiation (with a rise of 113.4%), Air and climate (up 106.6%) and Environmental R&D (88.6%). Meanwhile, Energy from renewable sources, Energy savings and management, Materials recovery and savings and Protection of biodiversity and landscape also recorded growth above the 53.7% increase in environmental GVA for the economy as a whole between those years.
Indicators of the environmental goods and services sector of the Basque Country by environmental purpose. 2015-2023
| |
Environmental GVA over % GDP |
Environmental Employment (FTE) over Total Employment (FTE) |
| |
2015 |
2022 |
2023 |
2015 |
2022 |
2023 |
| TOTAL CEP |
2.17 |
2.41 |
2.47 |
2.50 |
2.80 |
2.86 |
| CEP 01 - Air and climate |
0.13 |
0.20 |
0.19 |
0.13 |
0.19 |
0.19 |
| CEP 0201 - Energy from renewable sources |
0.08 |
0.09 |
0.10 |
0.04 |
0.08 |
0.08 |
| CEP 0202 - Energy savings and management |
0.60 |
0.67 |
0.75 |
0.62 |
0.75 |
0.81 |
| CEP 0301 - Wastewater management |
0.09 |
0.08 |
0.07 |
0.10 |
0.10 |
0.09 |
| CEP 0302 - Water savings and management of natural water resources |
0.01 |
0.02 |
0.02 |
0.02 |
0.02 |
0.02 |
| CEP 0401 - Waste management |
0.34 |
0.34 |
0.30 |
0.40 |
0.40 |
0.38 |
| CEP 0402 - Materials recovery and savings |
0.20 |
0.24 |
0.25 |
0.22 |
0.26 |
0.27 |
| CEP 0501 - Protection of soil, surface and groundwater |
0.12 |
0.10 |
0.11 |
0.19 |
0.17 |
0.18 |
| CEP 0502 - Protection of biodiversity and landscape |
0.01 |
0.02 |
0.02 |
0.02 |
0.03 |
0.02 |
| CEP 0503 - Management of forest resources |
0.11 |
0.13 |
0.11 |
0.09 |
0.10 |
0.09 |
| CEP 06 - Noise and radiation |
0.13 |
0.16 |
0.20 |
0.12 |
0.14 |
0.18 |
| CEP 07 - Research and development |
0 |
0 |
0.2 |
0.18 |
0.23 |
0.24 |
| CEP 08 - Cross-cutting and other environmental purposes |
0.23 |
0.21 |
0.19 |
0.37 |
0.33 |
0.31 |
Base 2022
Date November 28, 2025
Source: Eustat. Environmental accounts. Environmental goods and services account
Energy savings and management was, by far, the environmental purpose that contributed most to total environmental GVA as a percentage of GDP in both 2015 (0.60 percentage points) and 2023 (0.75 p.p.), representing 2.17% and 2.47%, respectively, in 2015 and 2023. Likewise, environmental FTE employment in Energy savings and management was the environmental purpose that contributed most to total environmental FTE employment in both 2015 (0.62 p.p.) and 2023 (0.81 p.p.), accounting for 2.50% and 2.86%, respectively, in 2015 and 2023.
Note:
The data published for the 2015-2023 series incorporate an update of the data with the new figures from the Economic Accounts, in accordance with the new estimates with the 2022 base year, including updated information on value added and full-time equivalent (FTE) employment.
Furthermore, the Environmental Goods and Services Account itself, in accordance with Eurostat recommendations and the regulatory reviews carried out by the European Commission since 2015 (Regulation (EU) 2015/2174, Regulation (EU) 2024/1769 and Delegated Regulation (EU) 2025/1131 amending Regulation (EU) 691/2011 on European Environmental Economic Accounts, which regulates the Environmental Goods and Services Sector Account), introduces a new Classification of Environmental Purposes (CEP) for data collection and the preparation and dissemination of this account, among other things.
The Classification of Environmental Purposes (CEP) uses the criterion of "environmental purpose" to classify environmental economic activities, environmental products (goods or services) and environmental expenditure according to the main objective they pursue in relation to environmental protection.
All of the above has led to a review of both the information sources and estimation methods used, resulting in improved estimates, which has had a particular impact on key sectors such as Energy, the Motor Industry and its auxiliaries, Materials Recovery, R&D, and the Public Administrations. In addition, the dissemination of information in accordance with the criteria established in the new CEP classification meets information policy requirements, the information needs of potential users, and the needs of various environmental and climate practices.
In the first phase, estimates of the final data for 2022 and 2023 were prepared in accordance with the new methodological and dissemination criteria. In the second phase, the data from the 2015-2021 series was reviewed, once again in accordance with these new criteria.
Methodological changes and changes related to shifting the base year to 2022 have resulted in a homogeneous set of data for the 2015–2023 series of the Environmental Goods and Services Account. The methodological improvements and change in base year have also led to a downward revision of the data previously published for 2021 and 2022 (estimates) in terms of production levels, value added and employment.